
Gone are the days when social media was just about our daily doses of humor and entertainment. Over the years, it has grown to be an epicenter of a range of digital marketing activities.
Brands have shifted their focus from mainstream marketing to improving their promotional strategies for social media. Here’s why- it’s easily accessible for all and has great selling potential!
As such, if you haven’t up scaled your social media marketing efforts yet, it’s time to gear up for the same to maintain a strong hold in your industry. And to help you in your endeavor’s, we’ve come up with this comprehensive guide on the latest trends in social media marketing and other significant insights. Do give it a read!
Why Are Social Media Stats Important?
A constantly evolving field such as social media will require businesses to update their marketing strategies accordingly. Thus, once you recognize and understand the trends and patterns in which it works, you’ll be able to plan better and stay ahead of competitors.
The list of social media stats that we’ve compiled will provide you with vital information on user behavior to brace up for 2024. In the end, you’ll be able to clearly identify your target audience and the touchpoints to connect with them.
Here are some critical questions that you can answer with these latest social media marketing statistics:
- How much engagement can a social media platform earn for your business?
- Which platform is most suitable for promoting your brand?
- What kind of content will drive the maximum engagement for your business?
A Heads-up For You
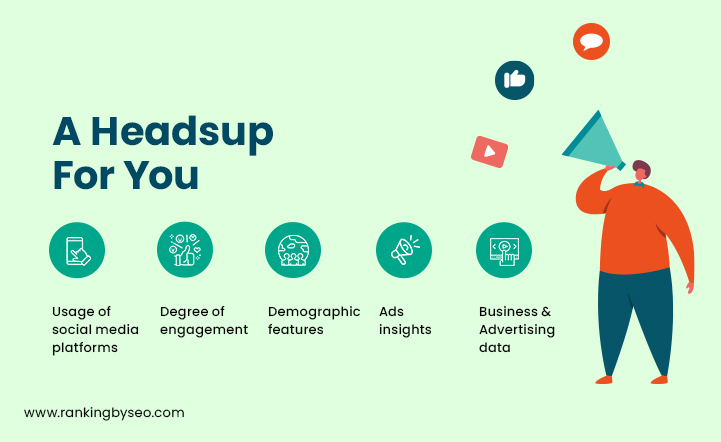
Before we take you through the recent trends and developments in social media, here’s a brief index of the attributes of the field that we’ll touch upon through the data:
Usage of social media platforms
These numbers will indicate how extensively social media users access a particular platform.
Degree of engagement
From such data, you can know the type of content users engage with on social platforms and the platforms that drive more engagement.
Demographic features
Demographic data will help you understand the characteristics of a population that uses a particular social platform, for example their age, gender, income, etc.
Ads insights
The numbers will tell you how much brands are investing in ads, the response the ads receive on such platforms, and their returns.
Business And Advertising data
The numbers tell you how companies use such platforms to market themselves- the utilization of customer service operations, social selling, content marketing, etc.
Social Media Marketing Statistics 2024

Social Media – The Broader Picture
1- Since 2012, social media platforms have recorded an annual growth rate of around 12%.
2- As of October 2022, approximately 4.74 billion people were using social media platform.
3- More than 93% of regular users of the internet use popular social media platform every month.
4- Social media platforms have been reported to grow at 4.2%, at a rate of six new users per second on average.
5- Recent data reveals that people aged between 20 and 29 are the biggest social media users, making up 32.2% of the global user base.
6- 72% of the US population uses social media platform.
7- Considering a sleep time of 7 to 8 hours daily, the latest figures suggest that people spend approximately 15% of their time on social media networks.
Social media Usage
8- Statista reported that the daily usage of Instagram by worldwide users was 147 minutes on average, which was 2-minute longer than last year.
9- The cumulative time spent on social media platforms daily was reported to be a staggering 10 billion hours- equivalent to almost 1.2 million years of our existence!
10- Philippines and Nigeria recorded the maximum social media usage in 2021.
11- People from Japan, South Korea, and the Netherlands spend the least amount of time on social media.
12- The average social media user logs nearly 7 out of 10 smartphones in use around the world today run on Android.
13- The average time spent on social media daily in the USA was 2 hours 3 minutes, slightly lesser than worldwide users.
14- Users mainly leverage social media to stay in touch with family and friends, with more than 47% of users listing this as a top use of social media.
15- People aged between 16 and 24 years use social media to the maximum extent and clock as much as 3 hours and 1 minutes daily.
16- In the last 12 months, the number of users active on social media went up by over 400 million, which was 9.9% higher than figure recorded for last year.
17- Short-form videos have been rated as the most effective type of content for social media by 54% of marketers.
Advertising On Social Media
18- The advertising revenue for 2024 has been estimated at $833 billion, 5% higher than in 2022.
19- Social media ads comprised 35% to $189 Billion in 2021 of the spending on digital advertising.
20- 52% of US adult social media users say their decision to interact with ads or sponsored content depends on whether the platform safeguards their data and privacy.
21- Social media Marketing is still the safest and most effective way to make your brand known to the audience. A survey revealed that targeted ads leveraging user data helped discover 50% products and services of their interest.
22- Brands are likely to shift their social media ad spend towards the relatively less common social media channels. Note that this doesn’t mean creators should stop using Twitter, Instagram, or Facebook for their ad campaigns. But they’ll need to include channels such as Pinterest, TikTok, and Snapchat in their ad budget.
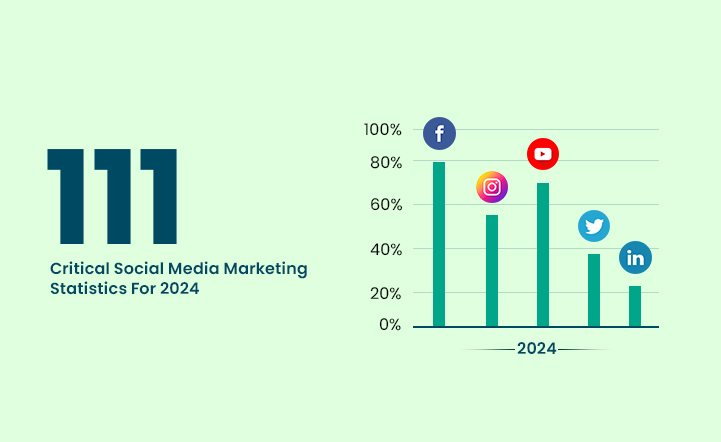
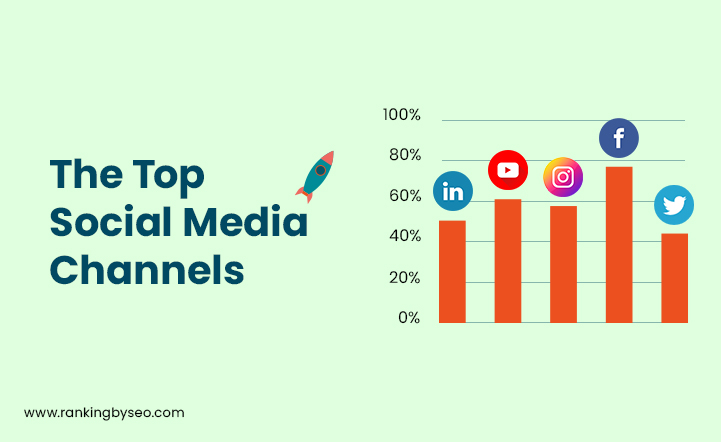
The Top Social Media Channels
Facebook continues to be a rage among social media enthusiasts despite other platforms gaining the spotlight in recent times. That’s why Facebook social giant is a must-have channel for your marketing initiatives.
Now, while many might be aware of the advertising power of this platform, keeping track of the recent developments in its state of marketing is important. This will allow you to make a well-thought-out Facebook marketing strategy based on what you infer from the data. So, do take a look at these latest social media marketing statistics before you build one:
General Facebook Statistics
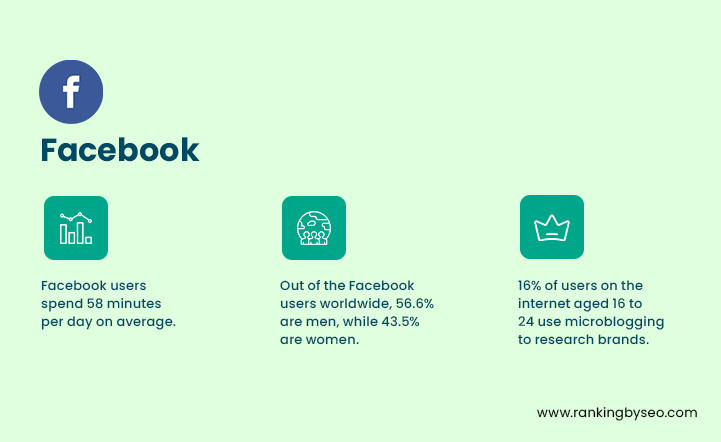
23- Facebook users spend 58 minutes per day on average.
24- Recent data suggests that the platform experienced a 3% growth in web traffic from one year to another.
25- Facebook stands third in terms of popularity, closely following Instagram and WhatsApp. It recorded 11.2 billion visits on the whole, an average of 31 min online time for every visit, and 1.5 billion unique visitors.
26- The average internet user in the US spends 35 minutes daily on the platform.
27- Only 1.7% of visitors check their Facebook accounts through a desktop Activity.
28- Video ads have been shown to perform better than other formats on Facebook.
29- Stories on Facebook are used by a whopping 300 million daily users.
30- In 2022, Facebook will continue to be the most widely used social media platform in Australia.
31- 31% of US users say they get news updates regularly from Facebook.
32- The average reach rate for Facebook is 8.60%.
33- Facebook Groups are used by 1.8 billion people every month and also has tens of millions of active communities.
Demographics
34- Out of the Facebook users worldwide, 56.6% are men, while 43.4% are women.
35- Facebook users in the United States aged between 25 and 34 constitute the largest Facebook audience in the country.
36- Teen viewership for Facebook has dropped considerably. Recent data revealed that 32% of people aged 13 to 17 using the platform compared to 71% in 2015.
37- India has the highest number of Facebook users, with 329.65 million people choosing the channel.
Brands
38- 16% of users on the internet aged 16 to 24 use microblogging to research brands.
39- Brand engagement on Facebook experienced significant drops in engagement in 2021 as compared to 2020.
40- 58% of customers said they visited a brand website through a story ad, while 31% people visited a store to browse.
41- Since the launch of Facebook’s e-commerce feature Shops in 2020, 250 million businesses put forth their products on their social media profiles within a year. This feature allows brands to create ads easily from their products with the aim to attract customers.
42- Facebook itself has been ranked the 7th most valuable brand by Statista, with its brand value estimated at 101.2 billion US dollars.
43- 66% of people using Facebook visit pages of local businesses at least once a week.
44- Statista revealed that roughly 63.5 million Facebook users in the United States made purchases through the Facebook in 2022.
Usage
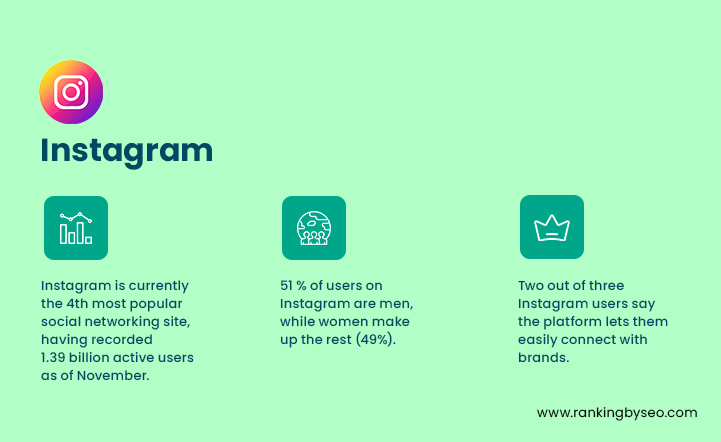
45- Instagram is currently the 4th most popular social networking site, having recorded 2 billion active users.
46- Reel ads on the platform reach 758.5 million users, as per data published in October, 2022.
47- Brunei is the country that recently recorded the highest Instagram audience reach with 89 percent.
48- Instagram ads reached 1.2 billion people, which translates to 20% of the world’s population over age 13.
49- 58% of the people using Instagram say they’ve clicked through to a brand website after coming across their stories.
50- According to a survey of active Instagram users, 91% reported watching videos on Instagram weekly.
51- 18 to 34-year-olds comprise the biggest group among the Instagram audience.
52- Love and Instagood are the most popular hashtags on Instagram, with more than 1.835 billion and 1.150 billion posts to their credit.
Demographics
53- Instagram is GenZ’s second-most favorite social networking platform, with 76% of youngsters utilizing the app to follow their interests and passion.
54- 51 % of users on Instagram are men, while women make up the rest (49%).
55- 59% of adults in the US use Instagram every day.
56- 91% of users active on the platform watch videos weekly.
57- India currently has more than 230 million Instagram users and is the fastest-growing market for the platform.
58- The maximum proportion of Instagram users (31.7%) are in the age group of 25-34.
Brands
59- Two out of three Instagram users say the platform lets them easily connect with brands.
60- Half of the users are more interested in a brand after they view an ad on Instagram.
61- The majority of users on this platform (90%) are followers of a business.
62- According to data, the top 25% of most active brands on Instagram post Stories in a month.
63- Stories posted by brands and businesses has risen by 12% in just over a one year period.
64- 57% of Instagram users prefer watching quizzes and polls from brands.
65- The average engagement earned on Instagram posts for a business account is 0.54%.
Usage
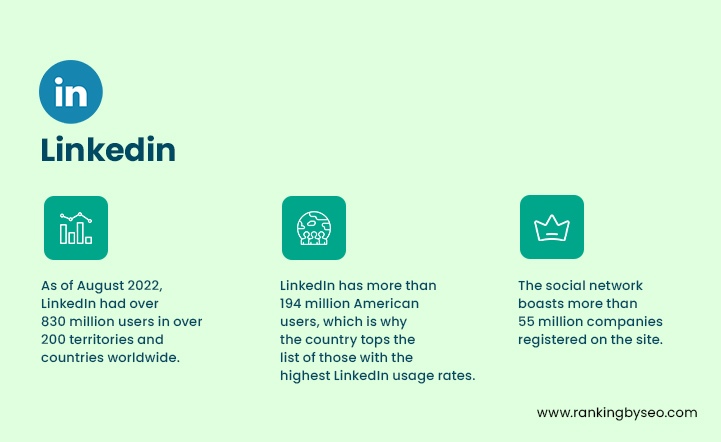
66- LinkedIn, the world’s leading professional networking platform with over 900 million users in over 200 territories and countries worldwide.
67- Nearly 1.5 billion global users visited LinkedIn this year, compared to 1.3 billion visitors in December 2021.
68- 25% of adults in the US have an account on LinkedIn.
69- 84% of users log into the platform for professional growth and advancement.
70- LinkedIn is used by 49 million people very week to search for employment.
71- Out of the users who engage with this social network frequently, 40% access it every day. This ultimately clocks up to 1 billion interactions per month.
72- 90 applications for employment are submitted every second on LinkedIn.
Demographics
73- LinkedIn has more than 194 million American users, more than 78% of LinkedIn users are based outside the US.
74- Pakistan, South Africa and Argentina are among the countries with the lowest rates of LinkedIn usage.
75- LinkedIn has nearly 60% of users aged between 25 and 34 years, while users older than 55 years make up merely 2.9%. In addition, it’s worth noting that the age group of 18-24 makes up 20.4% of the user base of the social network.
76- Almost 25% of users on LinkedIn are senior-level influencers, so the platform lets you target a substantial fraction of users who have great earning potential.
77- Such trends have made many B2B marketers shift towards LinkedIn for their advertising needs. In fact, 75% of B2B content marketers prefer the platform over other social media.
78- Interestingly, B2B organizations generate 80% of their social media leads through LinkedIn.
79- Over 39 million recent graduates and students use LinkedIn for professional networking.
80- The latest data from Statista reveals that 42% of worldwide LinkedIn users are women, whereas over 57% of the audience comprises male users.
Brands
81- The social network boasts more than 58.4 million+ companies registered on LinkedIn.
82- The brands with the highest network of followers include TED Conferences, Unilever, Forbes, Microsoft, Amazon, and Google.
83- The latest findings suggest that the audience distribution for LinkedIn ads is 42.8% for women and 57.2% for men.
84- As per the latest LinkedIn Statistics the current potential reach for LinkedIn paid marketing is 13%.
85- Brands have witnessed a 33% improvement in purchase intent as a result of the ad exposure on this platform.
YouTube
Usage
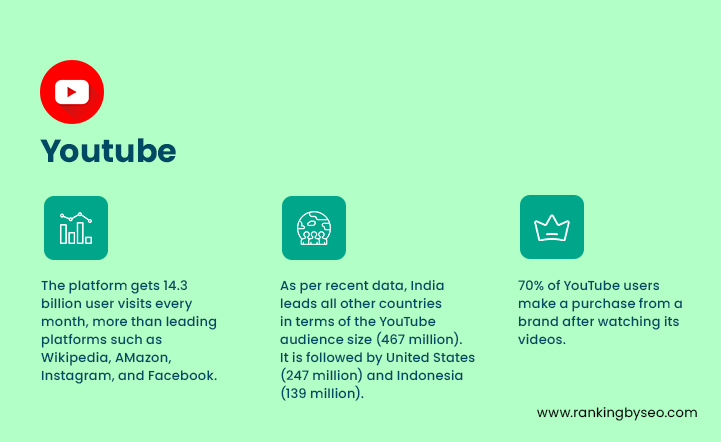
86- The platform gets 14.3 billion user visits every month, more than leading platforms such as Wikipedia, Amazon, Instagram, and Facebook.
87- YouTube Android users recorded an average watch time of 23.7 hours each per month.
88- The average time users spend on YouTube daily is 19 minutes.
89- YouTube sees 694,000 hours of video streaming every minute, a figure even higher than Netflix.
90- 22% of users access YouTube through mobile device.
91- Viewership of sports content on YouTube has been projected to reach 90 million in 2025.
92- The Shorts videos on YouTube have been viewed more than 5 trillion times!
Demographics
93- As per recent data, India leads all other countries in terms of the YouTube audience size (467 million). It is followed by United States (247 million) and Indonesia (139 million).
94- In the United States, 53.9% YouTube users are male, while the remaining 46.1% are female.
95- 80% of parents in the US have said that their children (aged below 11) watch YouTube.
Brands
96- 70% of YouTube users make a purchase from a brand after watching its videos.
97- Currently the most widely searched keywords are new song, dance, TikTOk, Karaoke and DJ.
98- Ads targeted on the basis of intent rather than demographics earn a 100% higher increase in buying intent.
Usage
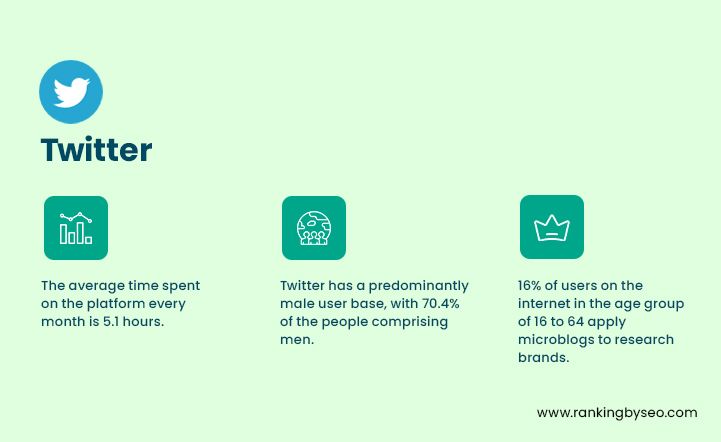
99- The average time spent on the Twitter platform every month is 5.1 hours.
100- Twitter is used by 22% of people in the US.
101- As of 2021, 38.5% of Twitter’s global audience was made up of users between the ages of 25 and 34.
102- By 2024, the number of Twitter users across the world has been estimated to reach 340 million.
103- 52% of Twitter users log into the platform daily, 96% monthly, and 84% weekly.
104- People are likely to spend a minimum of 6 minutes on Twitter daily in 2024.
105- 53% of Twitter users in the U.S check the platform regularly for news updates. In fact, it’s is the leading choice among all various social media platforms when it comes to getting the latest news on any field.
106- Organic social media platforms used by 82% of B2B content marketers in the last 12 months.
Demographics
107- Twitter had slightly more male users than female, with 56.4% of its global audience being male.
108- Users on Twitter aged 25-34 make up 38.5% of the audience.
119- 33% American users working with Twitter have college degrees.
Brands
110- 16% of users on the internet in the age group of 16 to 64 apply microblogs to research brands.
111- The advertising revenue earned by Twitter in 2021 was $1.41 billion, a 22% year-on-year increase.
What Makes a Strong Social Media Marketing Strategy?
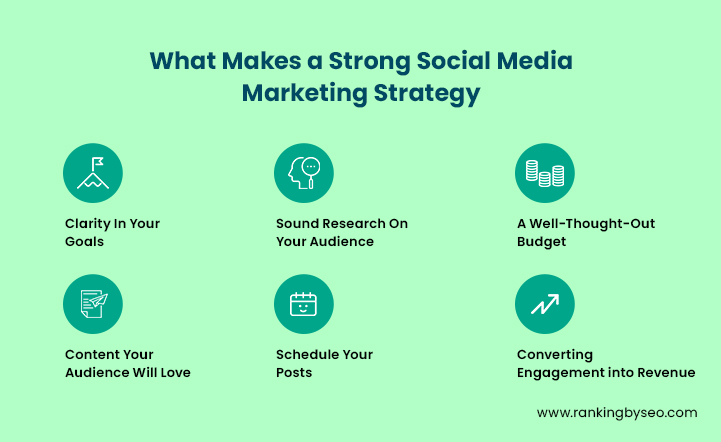
Clarity In Your Goals
First and foremost, be clear about what your business needs from social media networks.
You may solely want to increase your profits, but no matter what your goals are, having a clear path is essential to achieve them. Certain incremental steps are needed for driving business growth through social media:
a) Increase your reach
Get to more people who’re likely customers. In case you’re getting little or no traffic for your website or online profiles, tackle this problem before you proceed.
b) Make People Aware Of your Brand
Decide what you want people to know about your business. You’ll need to understand how people will remember you.
To emerge as an industry influencer, identify what will make people consider your brand when they need your product or service.
c) Drive Engagement
Things will work for you only if you get the social media audience engaged. This way, you can offer them “social proof” which will ultimately attract more prospective customers.
d) Generate leads
It might be that you service or product doesn’t come very cheap. In that case, you may have to generate leads that need personalized nurturing through email marketing or dedicated sales specialists.
e) Quick Sales
If your sold items need little forethought, you can opt for quick sales or subscriptions. Remember that these will be fruitful after you’ve completed one or two.
f) Increase Customer Value
Social media is perfect for re-engaging existing customers, as your outreach can encourage them to invest further in your offerings.
Sound Research On Your Audience
The next most important job after goal-setting is identifying your audience, and to that end, you’ll need organized research. Once you’re clear about who your audience and buying personas are, targeting their interests and needs will be a lot easier.
For this, you’ll have to know the people you’re trying to reach and why you want to reach them. This information will help you understand how to classify them as a group. For instance, a company selling sportswear might classify their target audience as athletes who prefer to don the best apparel for any match.
When you’re able to identify your audience and buyer personas, you’ll understand the content that will attract your particular type of customers.
A Well-Thought-Out Budget
To create a sound social media strategy that fetches results, you should know how much to spend on the marketing and where to spend it. Promoting your brand on social media involves several costs. And not planning a budget may lead to overspending or a difficulty in troubleshooting any problems that might arise during its execution.
After all, social media marketing isn’t about sharing posts or tweets in random and placing your trust on those. Here’s a brief outline of the elements of any social media budget, which will either cost you time or money:
- Content creation
- Split Testing, Research, And Analytics
- Automation
- Social Media Advertising
- Day-to-day social media management
Derive the results by tracking your time and expenditure for every category. In case you aren’t sure about what these components cost, you can easily get through it with online research.
Content Your Audience Will Love
If your content doesn’t interest a prospect, they’ll scroll down to the next post immediately. That’s why you should be extra careful with content creation.
Take some time to understand what would make your target audience engage with you. How can a particular content piece further your goals?
You’ll have to create an exhaustive content calendar that’s in line with your brand’s goals and will be loved by your potential customers. Make sure it’s able to answer the following questions to boost business growth:
q. What do your customers like or want?
q. Whom do they engage with?
q. Which social media platforms do they engage in?
q. What type of content do they engage with the most?
Related: Content Marketing Trends You Should Know
Schedule Your Posts
When it comes to social media marketing, uploading your posts at the right time is crucial for getting the desired engagement. It’s also important to monitor the posts regularly to understand their performance and make necessary modifications.
And the best way to meet these requirements conveniently is to apply a social media management solution. It’s an all-round solution that helps create a post from scratch, and then schedule and monitor it efficiently. Thus, it can save much of your time, letting you focus on other tasks.
Converting Engagement into Revenue
It’s undoubtedly important to gain followers and the desired engagement for your posts. But your efforts won’t bear fruit unless you turn these results into revenues for the business.
You’ll need to be clear about how your social media accounts are contributing to revenues. So, ensure that the all the posts contain links to your website. Here are the various ways you can add such links:
- Add links to the landing page along with an offer
- Include links to the blog posts in your social media
- Showcase new services or products
- Run contests to exchange contacts for a win. Most people prefer to communicate with businesses via email.
Conclusion

That was all about the overall state of businesses on social media. Hopefully, the data has helped you understand where social media is headed and how businesses can use it to reach out to customers effectively.
Understanding the changing dynamics of these leading social media platforms will help you chalk out a winning outreach strategy for 2024. So, choose the most suitable platform for your business and get the ball rolling! We wish you the very best!